Editor’s pick
AI ENGINEERING
Latest · Building Real-World AI
Technical deep dives into AI systems, agents, machine learning, and business impact.

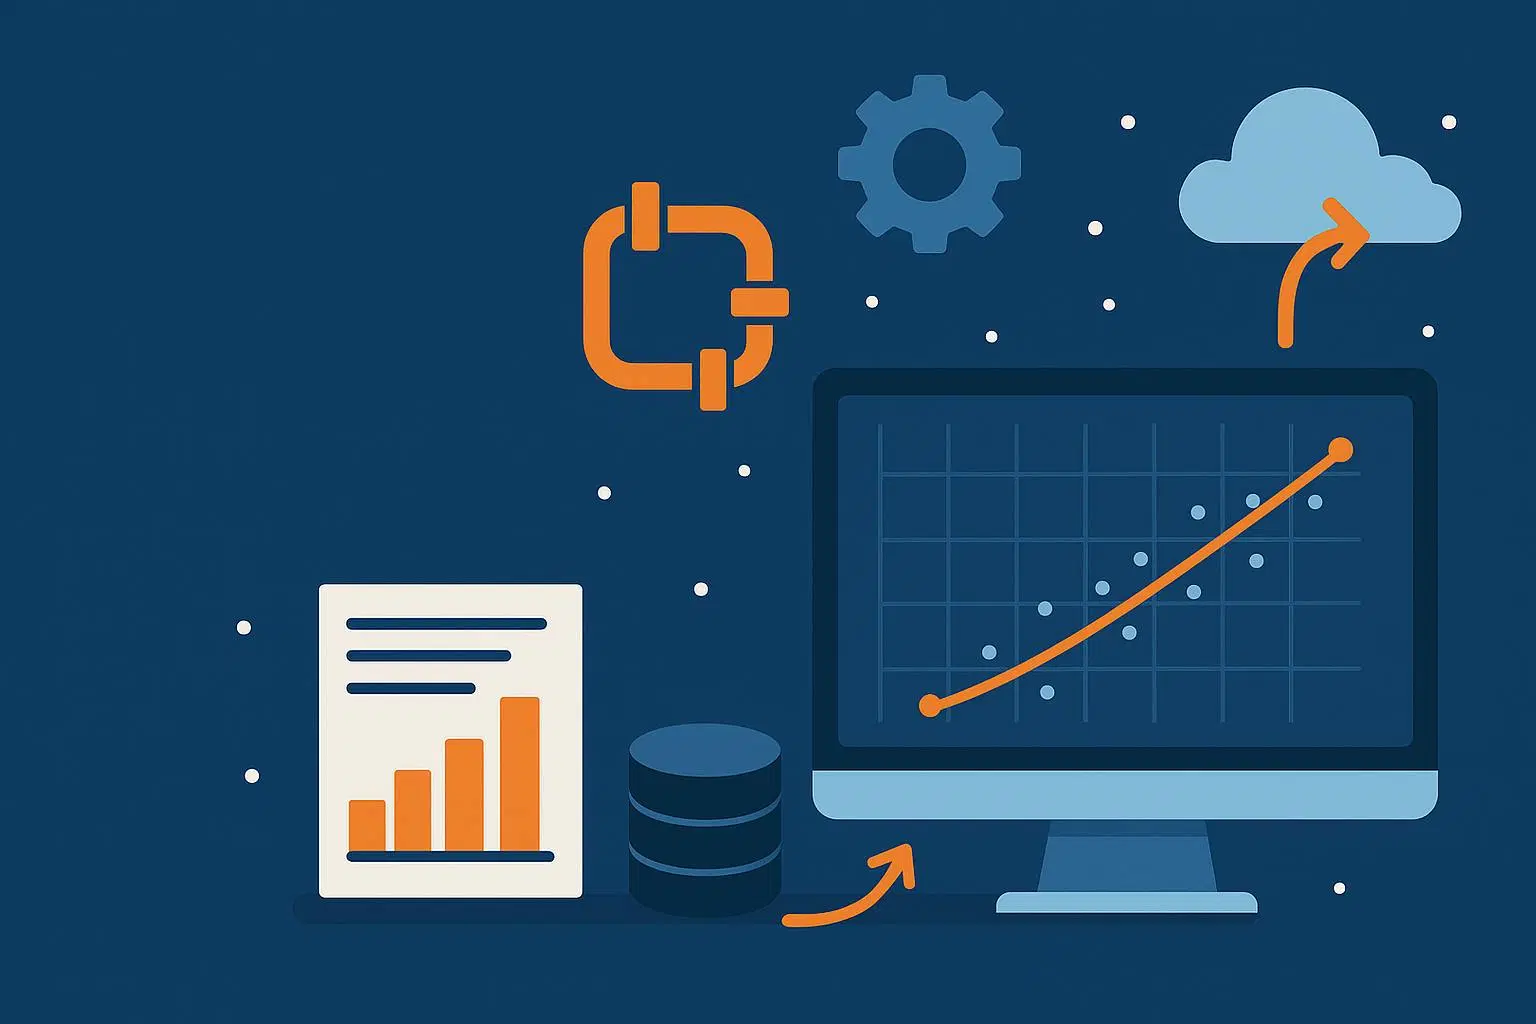
Deep Dives
Guides worth
bookmarking.
Deep guides on AI systems, enterprise architecture, and the
decisions that matter at scale.
Ideas before
they trend.
One email, every two weeks. No filler — just the thinking our team
uses to build enterprise-grade AI and software systems.
No spam. Unsubscribe anytime. Read by 4,800+ founders and engineers.
Browse by topic
01
Generative AI & LLMs
71 articles
02 · Artificial Intelligence
AI & Workflow Automation
36 articles
03
Machine Learning
9 articles
04
Industrial IoT (IIoT)
64 articles
05
Consumer IoT
27 articles
06
IoT Hardware & Sensors
31 articles
07
Mobile Development
49 articles
08
Web Development
26 articles
09
Product Development
26 articles
+10
MORE
TOPICS
Software
Web, Mobile &
Enterprise Software
Trends, frameworks, architecture, and development practices behind modern business applications.


IoT
IoT in Practice
Practical insights on IoT platforms, edge computing, device connectivity, and smart solutions.

Cloud
Cloud Computing
Infrastructure, DevOps, modernization, and cloud strategies for growing businesses.